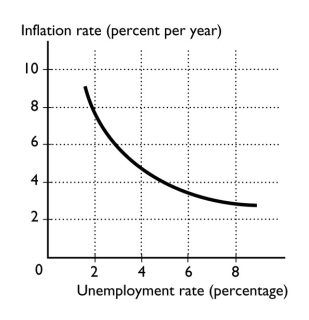
-The curve shown in the figure above is the
A) aggregate demand curve.
B) aggregate supply curve.
C) demand for money curve.
D) Phillips curve.
E) potential GDP curve.
Correct Answer:
Verified
Q8: The tradeoff exhibited by the short-run Phillips
Q9: The short-run Phillips curve shows the relationship
Q10: The natural unemployment rate and the expected
Q11: If the economy is at full employment,
Q12: The short-run Phillips curve is a curve
Q14: The short-run Phillips curve is another way
Q15: The short-run Phillips curve presents a tradeoff
Q16: The short-run Phillips curve is _ curve
Q17: The short-run Phillips curve is
A) downward sloping.
B)
Q18: The short-run Phillips curve illustrates _ relationship
Unlock this Answer For Free Now!
View this answer and more for free by performing one of the following actions

Scan the QR code to install the App and get 2 free unlocks

Unlock quizzes for free by uploading documents