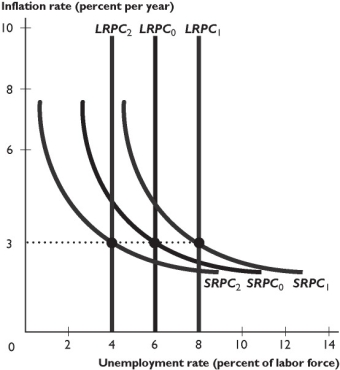
The figure above shows some Phillips curves for an economy.
-In the figure above, the shift from the short-run Phillips curve SRPC₀ and the long-run Phillips curve LRPC₀ to the short-run Phillips curve SRPC₁ and the long-run Phillips curve LRPC₁ is the result of ________ in the expected inflation rate and ________ in the natural unemployment rate.
A) an increase; an increase
B) a decrease; a decrease
C) no change; an increase
D) an increase; no change
E) a decrease; no change
Correct Answer:
Verified
Q167: Along a short-run Phillips curve when the
Q168: In the United States during the 1970s,
Q169: In 1981 Fed policy created a severe
Q171: The long-run Phillips curve represents the relationship
Q172: Along the short-run Phillips curve SRPC₀ the
Unlock this Answer For Free Now!
View this answer and more for free by performing one of the following actions

Scan the QR code to install the App and get 2 free unlocks

Unlock quizzes for free by uploading documents