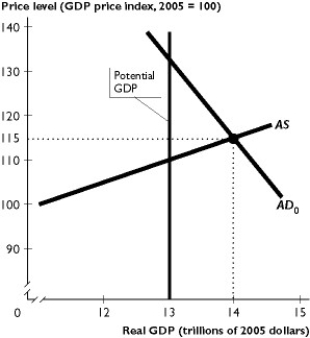
The figure above shows an economy's aggregate demand curve, aggregate supply curve, and potential GDP.
-In the figure above, to use fiscal policy to move the economy back to potential GDP, the government must decrease government expenditure by ________ $1 trillion and/or increase taxes by ________ $1 trillion.
A) recessionary; more than; more than
B) inflationary; less than; more than
C) inflationary; exactly; exactly
D) inflationary; less than; less than
E) recessionary; less than; less than
Correct Answer:
Verified
Q138: If we compare the United States to
Q139: How could an expansionary fiscal policy increase
Q140: Once supply side effects are taken into
Q141: Increasing the income tax rate _ the
Q142: If the nominal interest rate is 10
Q144: When taxes are cut, aggregate demand _
Q145: The quantity of employment is determined in
Q146: An income tax cut _ aggregate demand
Unlock this Answer For Free Now!
View this answer and more for free by performing one of the following actions

Scan the QR code to install the App and get 2 free unlocks

Unlock quizzes for free by uploading documents