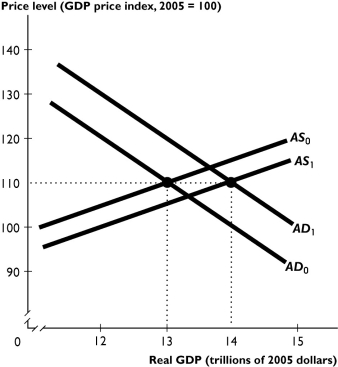
The figure above shows an economy aggregate demand curve and aggregate supply curves.
-Suppose the shift from AD₀ to AD₁ and from AS₀ to AS₁ is the result of fiscal policy.If the effect on aggregate supply was larger than the figure above shows, as a result the price level would be ________ 110 and real GDP would be ________ $14 trillion.
A) equal to; equal to
B) higher than; larger than
C) smaller than; larger than
D) equal to; larger than
E) smaller than; less than
Correct Answer:
Verified
Q175: Q176: Q177: Compare the views of Keynesian and mainstream Q180: Q182: Explain the difference between discretionary and automatic Q208: Explain how tax revenue can be both Q215: An economy is experiencing a recession and Q230: Ignoring any supply-side effects, how does the Q237: "The federal budget is required by law Q288: What are automatic stabilizers? How do they Unlock this Answer For Free Now! View this answer and more for free by performing one of the following actions Scan the QR code to install the App and get 2 free unlocks Unlock quizzes for free by uploading documents![]()
![]()
![]()

