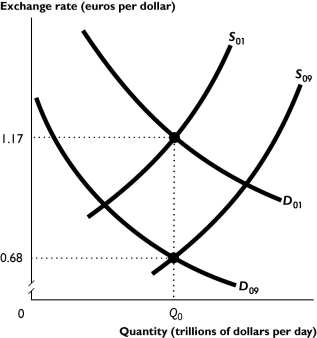
The figure above shows the market for foreign exchange in 2001 and 2009.
-Which of the following could have lead to the shifts illustrated in the figure above?
i. The U.S.exchange rate was expected to depreciate between 2001 and 2009.
ii. The U.S.exchange rate was expected to appreciate between 2001 and 2009.
iii. The U.S.interest rate rose relative to interest rates in other countries between 2001 and 2009.
A) i only
B) ii only
C) iii only
D) i and iii
E) ii and iii
Correct Answer:
Verified
Q203: Q204: Q205: Q206: Q207: Q209: Which of the following generally becomes positive Q210: What would the Fed have done if Unlock this Answer For Free Now! View this answer and more for free by performing one of the following actions Scan the QR code to install the App and get 2 free unlocks Unlock quizzes for free by uploading documents![]()
![]()
![]()
![]()
![]()

