Multiple Choice
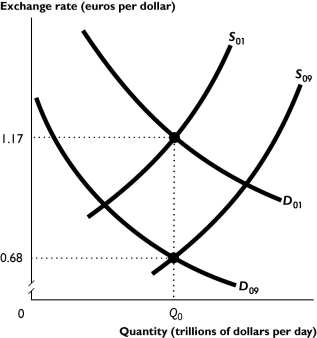
The figure above shows the market for foreign exchange in 2001 and 2009.
-Which of the following could have lead to the shifts illustrated in the figure above?
I.The U.S.exchange rate was expected to depreciate between 2001 and 2009.
Ii. The U.S.exchange rate was expected to appreciate between 2001 and 2009.
Iii. The U.S.interest rate fell relative to interest rates in other countries between 2001 and 2009.
A) i only
B) ii only
C) iii only
D) i and iii.
E) ii and iii.
Correct Answer:
Verified
Related Questions
Q212: If the exchange rate appreciates, then the
A)

