Multiple Choice
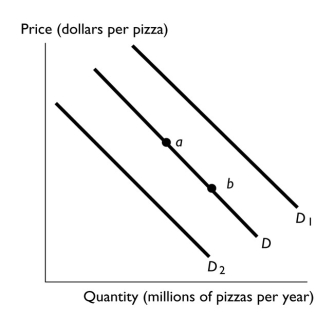
-In the above figure,the shift in the demand curve from D to D? can be the result of
A) an increase in income if pizza is a normal good.
B) an increase in the price of a sub sandwich, a substitute for pizza.
C) an increase in the price of soda, a complement to pizza.
D) a change in quantity demanded.
E) a decrease in the supply of pizza that raises the price of pizza.
Correct Answer:
Verified
Related Questions

