Multiple Choice
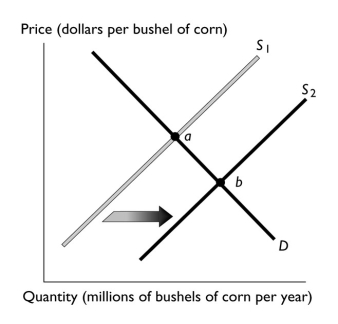
-The above figure illustrates the market for corn.If point "a" represents the original equilibrium and point "b" the new equilibrium,which of the following could have caused the change?
A) an increase in consumers' preferences for corn
B) an increase in consumers' income if corn is a normal good
C) an increase in labor costs of producing corn
D) an improvement in the technology of producing corn
E) an increase in consumers' income if corn is an inferior good
Correct Answer:
Verified
Related Questions
Q125: Q126: Q127: Q128: The number of corn producers increases,so the Q129: Which of the following increases the supply![]()
![]()
![]()

