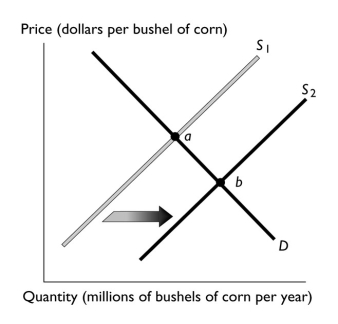
-The above figure illustrates the market for corn.If point "a" represents the original equilibrium and point "b" the new equilibrium,which of the following could have caused the change?
A) a decrease in the number of corn growers
B) a decrease the price of wheat, a substitute in production for corn
C) an increase in the cost of the seed used to grow the corn
D) an decrease in buyers' incomes if corn is an inferior good
E) an increased belief among buyers that corn is healthy
Correct Answer:
Verified
Q133: Advances in productivity increase supply because they
Q134: Q135: Which of the following increases the supply Q136: Q137: Which of the following shifts the supply Q139: Q140: Q141: If a higher price for wheat decreases Q142: Wheat is used to produce cereal.When the Q143: Unlock this Answer For Free Now! View this answer and more for free by performing one of the following actions Scan the QR code to install the App and get 2 free unlocks Unlock quizzes for free by uploading documents![]()
![]()
![]()
![]()
![]()

