Multiple Choice
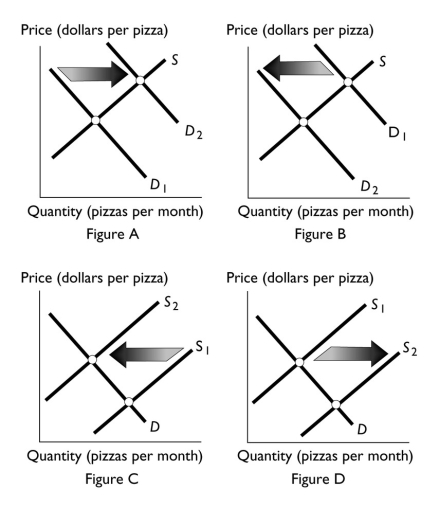
-Which figure above shows the effect of an increase in the cost of the tomato sauce used to produce pizza?
A) Figure A
B) Figure B
C) Figure C
D) Figure D
E) Both Figure B and Figure C
Correct Answer:
Verified
Related Questions
Q219: Suppose that over the next few years
Q220: When personal computers were first produced,the price

