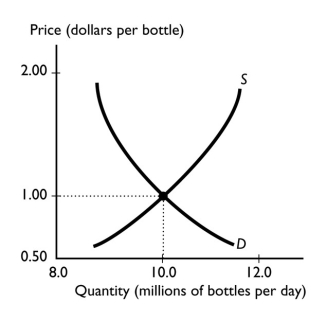
-The graph illustrates the market for bottled water.When the price exceeds the equilibrium price,the quantity demanded is ________ the quantity supplied and the price of the good will ________.
A) less then; fall
B) greater than; rise
C) greater than; fall
D) less than; rise
E) equal to; fall
Correct Answer:
Verified
Q244: If both producers and consumers believe that
Q245: Which of the following is correct?
i.A surplus
Q246: If the demand curve for desktop computers
Q247: If the demand and supply both increase
Q248: Both the demand for and supply of
Q250: A competitive market is in equilibrium.Then there
Q251: A competitive market is in equilibrium.Then there
Q252: If both the supply and demand curves
Q253: Suppose that the demand curve for desktop
Q254: Suppose the government imposes a small carbon
Unlock this Answer For Free Now!
View this answer and more for free by performing one of the following actions

Scan the QR code to install the App and get 2 free unlocks

Unlock quizzes for free by uploading documents