Multiple Choice
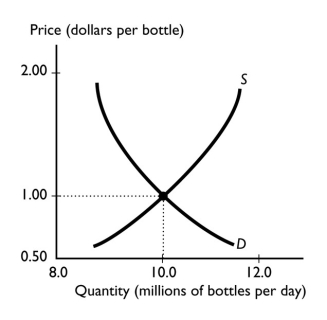
-The graph illustrates the market for bottled water.If the producers of bottled water switch to using improved technology,then the
A) supply of bottled water decreases.
B) quantity demanded of bottled water increases.
C) quantity demanded of bottled water does not change.
D) price of bottled water rises.
E) supply curve shifts leftward.
Correct Answer:
Verified
Related Questions
Q260: The demand for cat food decreases while
Q261: Q262: Consider the market for turkeys.In the United Q263: Consider the market for bread.If the price![]()
Unlock this Answer For Free Now!
View this answer and more for free by performing one of the following actions

Scan the QR code to install the App and get 2 free unlocks

Unlock quizzes for free by uploading documents