Multiple Choice
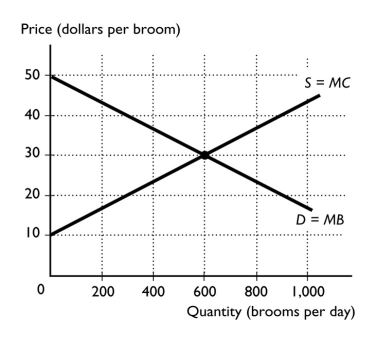
-The figure above shows the market for brooms.If the market is efficient,
A) 0 brooms are produced.
B) 600 brooms are produced.
C) more than 1000 brooms are produced.
D) between 0 and 600 brooms are produced.
E) between 600 and 1000 brooms are produced.
Correct Answer:
Verified
Related Questions
Q285: Which of the following is true?
i.Production efficiency
Q286: Which of the following is true? When

