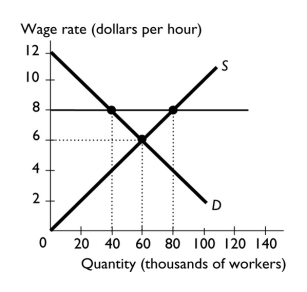
-The figure above shows the labor market in a region.If a minimum wage of $8 an hour is imposed,then the quantity of labor supplied is ________ and the quantity of labor demanded is ________.
A) 60,000; 60,000
B) 80,000; 40,000
C) 40,000; 60,000
D) 60,000; 40,000
E) 40,000; 40,000
Correct Answer:
Verified
Q86: Q87: Suppose the equilibrium price of a gallon Q88: Suppose the current equilibrium wage rate for Q89: Why do some workers lose their job Q90: In the labor market,as wages rise,households Q92: Q93: A price floor Q94: Suppose the equilibrium wage rate for apricot Q95: Q96: Unlock this Answer For Free Now! View this answer and more for free by performing one of the following actions Scan the QR code to install the App and get 2 free unlocks Unlock quizzes for free by uploading documents![]()
A) decrease![]()
A) changes the equilibrium price![]()
![]()

