Multiple Choice
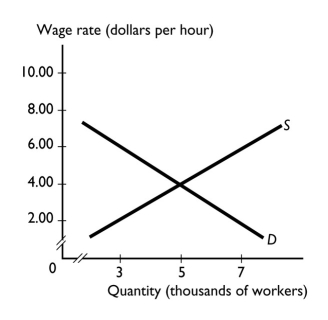
-The graph shows the labor market for painters.The lower the wage rate,the ________ is the quantity of painters that firms demand and the ________ is the quantity of painters that households are willing to supply.
A) greater; smaller
B) greater; greater
C) smaller; greater
D) smaller; smaller
E) None of the above answers is correct because both the demand and supply curves will shift in response to the change in the wage rate.
Correct Answer:
Verified
Related Questions

