Multiple Choice
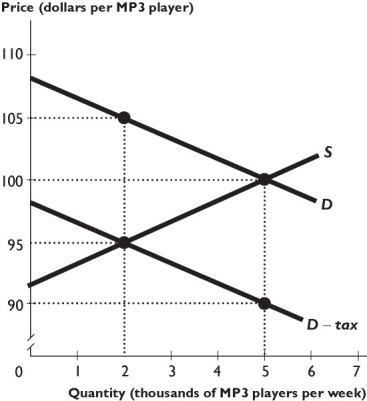
The figure above shows the market for MP3 players, where S is the supply curve and D is the demand curve before any tax. The government imposes a $10 per unit tax on buyers of MP3 players.
-After the tax is imposed,the price received by the seller is ________ per MP3 player.
A) $105
B) $100
C) $95
D) $110
E) $90
Correct Answer:
Verified
Related Questions

