Multiple Choice
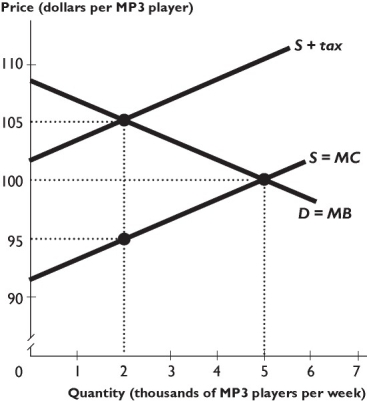
The figure above shows the market for MP3 players, where S is the supply curve and D is the demand curve before any tax is imposed. The government imposes a $10 per unit tax on sellers of MP3 players.
-Based on the figure above,after the tax is imposed,the consumer surplus
A) decreases by $17,500.
B) increases by $17,500.
C) decreases by $7,500.
D) increases by $7,500.
E) does not change.
Correct Answer:
Verified
Related Questions

