Multiple Choice
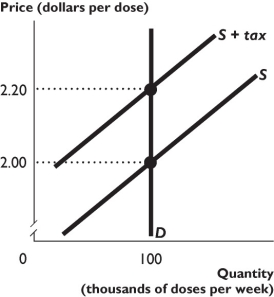
The figure above shows the demand (D) and supply (S) curves for insulin before any tax is imposed. The government imposes a $0.20 a dose tax on sellers of insulin.
-Based on the figure above,at the market equilibrium with the tax,marginal benefit ________ marginal cost,and the quantity of insulin sold is ________.
A) equals; efficient
B) exceeds; inefficient
C) is below; inefficient
D) is below; efficient
E) exceeds; efficient
Correct Answer:
Verified
Related Questions

