Multiple Choice
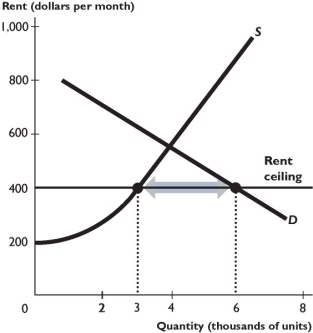
The figure above shows the supply and demand curves in the market for rental housing. A rent ceiling is set at $400 per month.
-In the figure above,with the rent ceiling
A) there is a shortage of 3,000 units.
B) there is a surplus of 3,000 units.
C) there is a surplus of 2,000 units.
D) there is a shortage of 1,000 units.
E) the market is in equilibrium.
Correct Answer:
Verified
Related Questions

