Multiple Choice
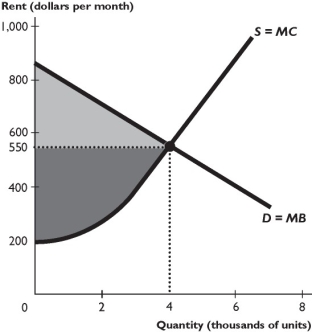
The figure above shows the supply and demand curves in the market for rental housing. A rent ceiling is set at $400 per month.
-As shown in the figure above,the rent ceiling
A) decreases consumer surplus.
B) increases producer surplus.
C) decreases deadweight loss.
D) increases the quantity of housing rented.
E) is efficient.
Correct Answer:
Verified
Related Questions

