Multiple Choice
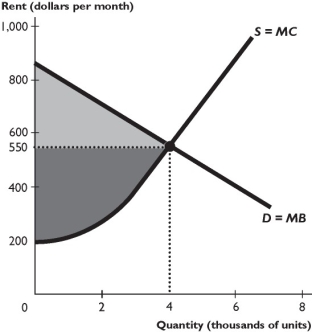
The figure above shows the supply and demand curves in the market for rental housing. A rent ceiling is set at $400 per month.
-As shown in the figure above,the rent ceiling ________ consumer surplus and ________ producer surplus.
A) decreases; decreases
B) decreases; increases
C) increases; increases
D) increases; decreases
E) decreases; does not change
Correct Answer:
Verified
Related Questions
Q184: Q185: The unemployment caused by minimum wage would Q186: ![]()
![]()

