Multiple Choice
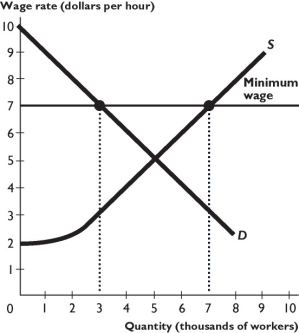
The figure above shows supply and demand in the market for labor. The government introduces a minimum wage of $7 per hour.
-In the figure above,the number of workers employed is ________,and the wage paid is ________.
A) 3,000; $7 per hour
B) 7,000; $7 per hour
C) 5,000; $5 per hour
D) 5,000; $7 per hour
E) 3,000; $5 per hour
Correct Answer:
Verified
Related Questions
Q181: Q182: Q183: The shortage created by a price ceiling![]()
![]()

