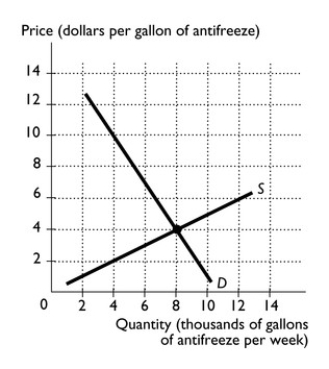
-The figure above illustrates the market for antifreeze.Suppose the government decides to impose an $8 sales tax on every gallon of antifreeze sold.
a.In the figure,illustrate the effect the tax has on the market for antifreeze.
b.What is the equilibrium price of a gallon of antifreeze before the tax? What is the price paid by buyers after the tax?
c.What is the equilibrium quantity of antifreeze before the tax? What is the equilibrium quantity after the tax?
d.What is the revenue collected by the government from this tax?
e.Do buyers or sellers bear the largest burden of the tax?
f.Illustrate the deadweight loss created by the tax.
Correct Answer:
Verified
a.The tax shifts the supply curve,as i...
View Answer
Unlock this answer now
Get Access to more Verified Answers free of charge
Q239: A tax on labor income _ the
Q240: Explain under what conditions a sales tax
Q241: Q242: Q243: Ali earns $20,000 and pays $2,000 in Q245: "For the U.S.personal income tax,the average tax Unlock this Answer For Free Now! View this answer and more for free by performing one of the following actions Scan the QR code to install the App and get 2 free unlocks Unlock quizzes for free by uploading documents![]()
![]()

