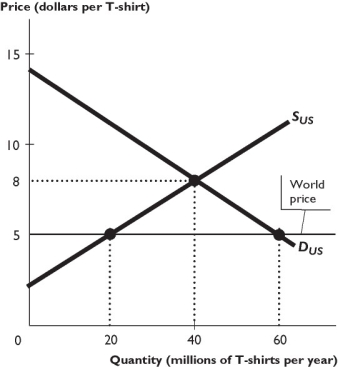
The figure above shows the U.S. market for T-shirts, where SUS is the domestic supply curve and DUS is the domestic demand curve. The United States trades freely with the rest of the world. The world price of a T-shirt is $5.
-In the figure above,with international trade U.S.consumers buy ________ million T-shirts per year at ________ per T-shirt.
A) 60; $5
B) 40; $8
C) 20; $5
D) 40; $5
E) 60; $11
Correct Answer:
Verified
Q197: Suppose the United States subsidizes domestic chicken
Q198: What is the infant-industry argument for protection
Q199: What is the national security argument to
Q200: When politicians debated the North American Free
Q201: The argument that it is necessary to
Q203: Why do governments in less-developed nations impose
Q204: While high-paid American workers fear competition with
Q205: What is rent seeking with respect to
Q206: The two main reasons why international trade
Q207: Which of the following groups gain from
Unlock this Answer For Free Now!
View this answer and more for free by performing one of the following actions

Scan the QR code to install the App and get 2 free unlocks

Unlock quizzes for free by uploading documents