Multiple Choice
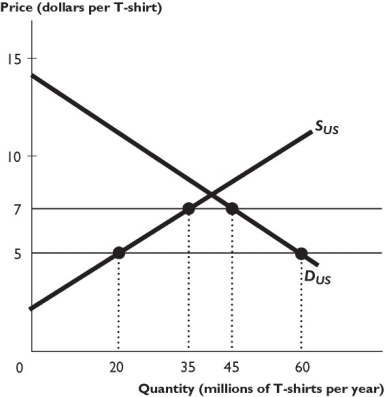
The figure above shows the U.S. market for T-shirts, where SUS is the domestic supply curve and DUS is the domestic demand curve. The world price of a T-shirt is $5. The U.S. government imposes a $2 per unit tariff on imported T-shirts.
-The figure above shows that as a result of the tariff,producer surplus in the United States
A) decreases by $105 million per year.
B) increases by $55 million per year.
C) decreases by $30 million per year.
D) decreases by $20 million per year.
E) remains unchanged.
Correct Answer:
Verified
Related Questions

