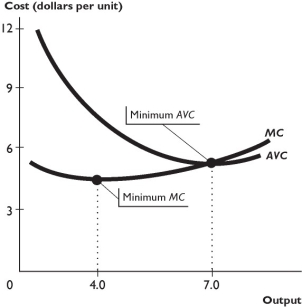
The figure above shows a firm's average total cost and marginal cost curves.
-Based on the figure above,the firm's marginal product curve slopes upward at levels of output between ________ and the firm's average product curve slopes upward at levels of output between ________.
A) 4.0 and 7.0; 4.0 and 7.0
B) 0 and 7.0; 4.0 and 7.0
C) 4.0 and 7.0; 0 and 4.0
D) 0 and 4.0; 0 and 7.0
E) More information is needed to answer the question.
Correct Answer:
Verified
Q225: Which of the following curves are U-shaped?
i.average
Q226: Professor Rush decided to quit teaching economics
Q227: As output increases,average total cost decreases
A) constantly.
B)
Q229: Marginal cost
A) is the difference between total
Q232: Once production has reached the maximum average
Q233: The marginal cost curve intersects the _
Q234: The average product curve
A) initially falls then
Unlock this Answer For Free Now!
View this answer and more for free by performing one of the following actions

Scan the QR code to install the App and get 2 free unlocks

Unlock quizzes for free by uploading documents