12.6 Chapter Figures
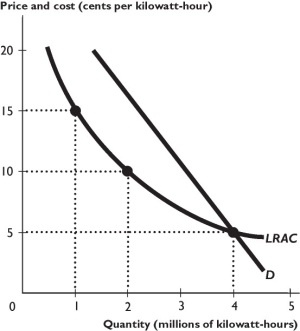
The figure above shows a firm's demand and average total cost curves.
-The situation in the figure above creates a barrier to entry for a second firm because i. a second firm that produced as many kilowatt-hours as the first firm would see the market price fall beneath its cost and would incur an economic loss.
Ii. a second firm that produced fewer kilowatt-hours than the first firm would have to charge a higher price and would not gain many customers.
Iii. the first firm's average total cost curve indicates it has been given a patent for the product.
A) i only
B) ii only
C) iii only
D) i and ii
E) i and iii
Correct Answer:
Verified
Q283: Q287: Q290: Q290: Q301: Q302: Monopolies arise when there are Q303: The total revenue test using the price Unlock this Answer For Free Now! View this answer and more for free by performing one of the following actions Scan the QR code to install the App and get 2 free unlocks Unlock quizzes for free by uploading documents![]()
![]()
![]()
![]()
![]()
A) many substitutes

