Examine the figure below. If each sugar molecule represents a percentage point of sugar dissolved in the solution, what change would you expect to see in the solution level over time and why? 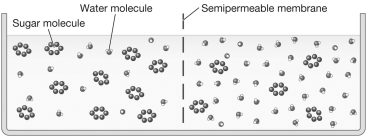
A) The solution level on the left side of the figure would rise while the solution level on the right side of the figure would decrease. This is because the solution on the left side of the figure is hypertonic while the solution on the right side of the figure is hypotonic.
B) The solution level on the left side of the figure would decrease while the solution level on the right side of the figure would rise. This is because the solution on the left side of the figure is hypertonic while the solution on the right side of the figure is hypotonic.
C) The solution level on the left side of the figure would decrease while the solution level on the right side of the figure would rise. This is because the solution on the left side of the figure is hypotonic while the solution on the right side of the figure is hypertonic.
D) There will be no net movement of water because the solutions are isotonic.
Correct Answer:
Verified
Q2: Dialysis tubing is a selectively permeable membrane
Q7: You are in lab attempting to prepare
Q13: Some antibiotics used to treat bacterial infections
Q14: Which of the following can be used
Q17: Adenine (A),thymine (T),guanine (G),and cytosine (C)are the
Q19: During the process of _,water diffuses across
Q23: An amoeba,a protozoan that moves by pseudopodia,approaches
Q27: The boundary that surrounds the contents of
Q30: You buy a bunch of small,round,red radishes
Q31: A protein molecule,transferrin,embedded in the plasma membrane
Unlock this Answer For Free Now!
View this answer and more for free by performing one of the following actions

Scan the QR code to install the App and get 2 free unlocks

Unlock quizzes for free by uploading documents