Examine the figure below. If each sugar molecule represents a percentage point of sugar dissolved in the solution, what change would you expect to see in the solution level over time and why? 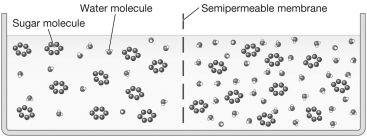
A) The solution level on the left side of the figure would rise while the solution level on the right side of the figure would decrease. This is because the solution on the left side of the figure is hypertonic while the solution on the right side of the figure is hypotonic.
B) The solution level on the left side of the figure would decrease while the solution level on the right side of the figure would rise. This is because the solution on the left side of the figure is hypertonic while the solution on the right side of the figure is hypotonic.
C) The solution level on the left side of the figure would decrease while the solution level on the right side of the figure would rise. This is because the solution on the left side of the figure is hypotonic while the solution on the right side of the figure is hypertonic.
D) There will be no net movement of water because the solutions are isotonic.
Correct Answer:
Verified
Q23: Many important cellular functions in eukaryotic cells
Q23: An amoeba,a protozoan that moves by pseudopodia,approaches
Q26: Ribosomes are very small nonmembranous organelles that
Q26: Which of the following would be likely
Q27: The boundary that surrounds the contents of
Q30: You buy a bunch of small,round,red radishes
Q31: A protein molecule,transferrin,embedded in the plasma membrane
Q36: Which of the following would be likely
Q38: Using the compound light microscope in the
Q40: A factory with an office that controls
Unlock this Answer For Free Now!
View this answer and more for free by performing one of the following actions

Scan the QR code to install the App and get 2 free unlocks

Unlock quizzes for free by uploading documents