The graph below indicates that global temperatures have 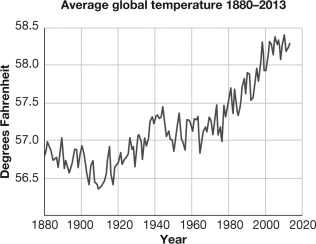
A) varied randomly over the last 160 years.
B) shown no real trend over the last 160 years.
C) tended to increase, especially in the last 100 years.
D) tended to decrease over the last 160 years.
Correct Answer:
Verified
Q22: Which of the following activities would have
Q24: Which of the following does NOT represent
Q25: An increase in average temperatures worldwide is
Q27: Climate change will affect
A) animals but not
Q31: Why are there many deserts at 30°
Q32: Global warming
A)occurs mainly at the equator.
B)occurs mainly
Q37: Not all gases are greenhouse gases.Which of
Q38: Historically,an unusual aspect of the recent rise
Q39: Which term encompasses all the others?
A) climate
Q75: Describe how both biotic and abiotic factors
Unlock this Answer For Free Now!
View this answer and more for free by performing one of the following actions

Scan the QR code to install the App and get 2 free unlocks

Unlock quizzes for free by uploading documents