This graph shows the growth of a population of Paramecium caudatum. The greatest amount of daily growth occurred when the population was at approximately ________ percent of its carrying capacity. 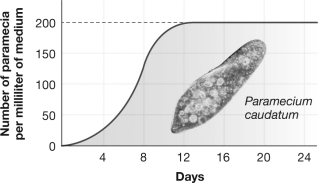
A) 10
B) 25
C) 50
D) 100
Correct Answer:
Verified
Q3: Which of the following populations would be
Q11: The term population density describes the
A) body
Q18: A new species is introduced into a
Q27: The carrying capacity for Paramecia caudatum as
Q28: The top of the "S"in an S-shaped
Q31: The carrying capacity of owls in an
Q36: Is it reasonable to expect that all
Q38: Lynx feed on rabbits, and the growth
Q40: The decrease in the availability of food
Q40: Density-dependent factors are more likely to limit
Unlock this Answer For Free Now!
View this answer and more for free by performing one of the following actions

Scan the QR code to install the App and get 2 free unlocks

Unlock quizzes for free by uploading documents