This graph shows which of the following? 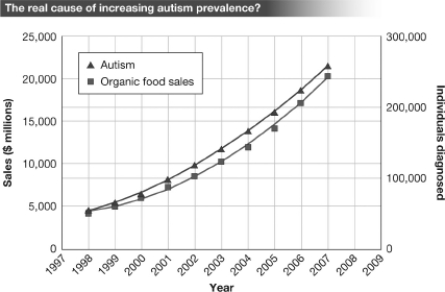
A) There is a positive correlation between the sale/consumption of organic food and the number of individuals diagnosed with autism between 1998 and 2007.
B) The increased consumption of organic food has led to an increase in the rate of autism between 1998 and 2007.
C) Consuming organic food causes autism.
D) There is positive evidence that a cause-and-effect relationship exists between the consumption of organic food and the development of autism.
Correct Answer:
Verified
Q14: Announcing "scientific" findings in a press conference
Q22: Announcing "scientific" findings in a press conference
Q24: You are reading a paper in the
Q26: A popular meme on the Internet states
Q27: The reliability of primary scientific literature is
Q31: Developing a scientific understanding of a natural
Q33: When determining whether or not a claim
Q35: Sue has twin baby boys and is
Q37: Which of the following is NOT a
Q40: A researcher noticed that as the prevalence
Unlock this Answer For Free Now!
View this answer and more for free by performing one of the following actions

Scan the QR code to install the App and get 2 free unlocks

Unlock quizzes for free by uploading documents