At 10 hours,the population shown in this graph has reached the: 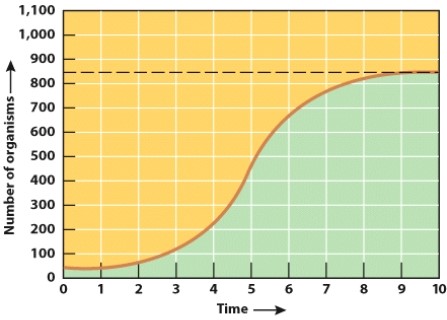
A) carrying capacity for this environment.
B) biotic potential of the organism.
C) J-curve plateau.
D) J-curve dip.
Correct Answer:
Verified
Q20: Charles Darwin used which term to describe
Q21: Which organism is not a typical example
Q22: Which type of survivorship curve is represented
Q23: Where in the diagram has human activity
Q24: In the diagram,which letter is most likely
Q26: The two main types of geochemical cycles
Q27: Which is not included in the measure
Q28: Which is a chemical responsible for acid
Q29: Which term could be filled in for
Q30: In this figure,at which trophic level is
Unlock this Answer For Free Now!
View this answer and more for free by performing one of the following actions

Scan the QR code to install the App and get 2 free unlocks

Unlock quizzes for free by uploading documents