The image below is of the Keeling Curve. This tells us that the concentration of carbon dioxide in the Earth's atmosphere over the past 50 years 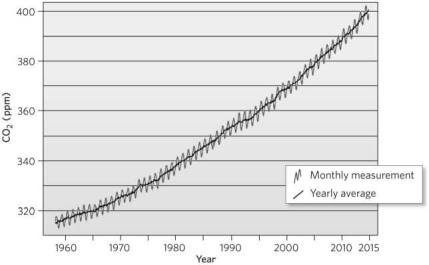
A) is increasing.
B) is decreasing.
C) is constant.
D) fluctuates on a 10-year cycle.
Correct Answer:
Verified
Q9: When averaged over time, the amount of
Q10: Which of the following best explains why
Q11: During autumn in the Northern Hemisphere, which
Q12: Based on the image below, which region
Q13: Why did Charles Keeling choose to install
Q15: Climate varies with latitude because of the
A)thickness
Q16: Which of the following is least likely
Q17: Water has a high heat capacity, which
Q18: The Earth's _ is the surface and
Q19: The conditions of air temperature, relative humidity,
Unlock this Answer For Free Now!
View this answer and more for free by performing one of the following actions

Scan the QR code to install the App and get 2 free unlocks

Unlock quizzes for free by uploading documents