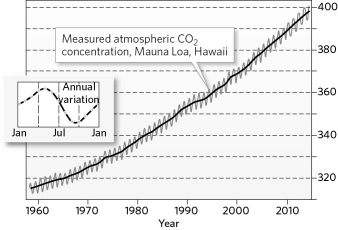
The graph below is the Keeling Curve, a record of carbon dioxide measured at Mauna Loa beginning in 1958. What can be learned from this graph? What do the two lines (black and grey) tell us?
Correct Answer:
Verified
View Answer
Unlock this answer now
Get Access to more Verified Answers free of charge
Q42: Global climate change is likely to affect
Q43: Is the primary cause of recent climate
Q44: Global climate models predict that if greenhouse
Q45: Changes in a system that enhance the
Q46: How is a history of global climate
Q48: Based on the graph below, average annual
Q49: Milankovitch cycles involve changes in the shape
Q50: What is a paleoclimate indicator? Provide three
Q51: Which of the following is NOT a
Q52: Since the industrial revolution, the amount of
Unlock this Answer For Free Now!
View this answer and more for free by performing one of the following actions

Scan the QR code to install the App and get 2 free unlocks

Unlock quizzes for free by uploading documents