Exhibit 2-7
a.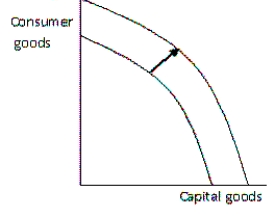
b.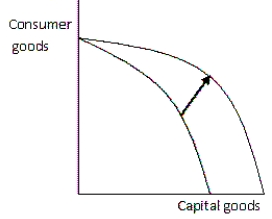
C. 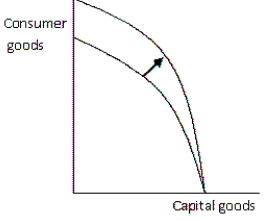 d.
d.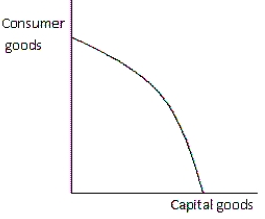
-Refer to the exhibit.Suppose a country's rate of immigration increases dramatically.Which graph best illustrates the impact on the production possibilities frontier?
A) graph a
B) graph b
C) graph c
D) graph d
Correct Answer:
Verified
Q108: Which of the following is a reason
Q109: Suppose a production possibilities curve is a
Q110: Which of the following would shift the
Q111: Which of the following would shift the
Q112: Assume a bowed-out shape of a production
Q114: What does any movement along the production
Q115: Assume a bowed-out production possibilities frontier showing
Q116: Suppose there is an improvement in technology.Which
Q117: Which of the following would shift the
Q118: Suppose there is an improvement in technology.Which
Unlock this Answer For Free Now!
View this answer and more for free by performing one of the following actions

Scan the QR code to install the App and get 2 free unlocks

Unlock quizzes for free by uploading documents