Exhibit 16-3
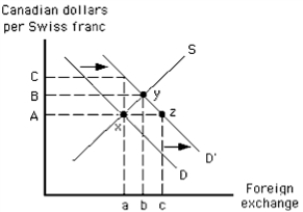
-Refer to the graph in the exhibit.Which of the following is represented?
A) an increase in the Canadian demand for Swiss francs
B) an increase in the Swiss demand for Canadian dollars
C) a decrease in Canadian exports to Switzerland
D) a devaluation of the Swiss franc
Correct Answer:
Verified
Q76: What is the shape for the demand
Q77: Suppose the Canadian dollar depreciates relative to
Q78: Which of the following does NOT explain
Q79: Suppose the Canadian dollar appreciates in the
Q80: What does the demand curve for euros
Q82: Suppose Canadian consumers start buying more shoes
Unlock this Answer For Free Now!
View this answer and more for free by performing one of the following actions

Scan the QR code to install the App and get 2 free unlocks

Unlock quizzes for free by uploading documents