Exhibit 16-4
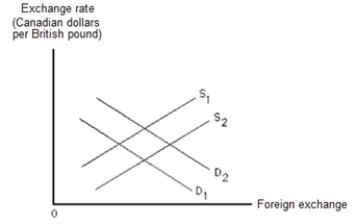
-Refer to the graph in the exhibit.Suppose Canadian tastes for British goods increase.How will the graph change?
A) The supply curve will shift from S₁ to S₂.
B) The supply curve will shift from S₂ to S₁.
C) The demand curve will shift from D₂ to D₁.
D) The demand curve will shift from D₁ to D₂.
Correct Answer:
Verified
Q85: What would be the effect of a
Q86: Which of the following is NOT assumed
Q87: Exhibit 16-3 Q88: Which of the following would increase the Q89: Suppose Canadian demand for foreign exchange increases.How Q91: Which of the following best describes a Q92: What would be the effect of a Q93: When supply and demand analysis is used Q94: What would be the effect of an Q95: Exhibit 16-3
![]()
![]()
Unlock this Answer For Free Now!
View this answer and more for free by performing one of the following actions

Scan the QR code to install the App and get 2 free unlocks

Unlock quizzes for free by uploading documents