Multiple Choice
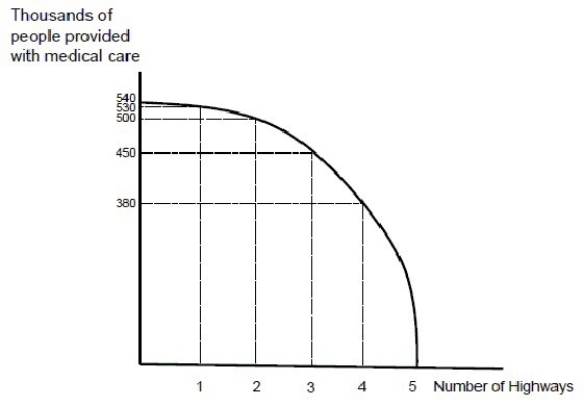
Figure 2.2
-Figure 2.2 presents a production possibilities curve for a given year for a country that can either produce highways or provide people with medical care.The figure shows that the production possibilities curve is
A) bowed inward.
B) bowed outward.
C) a straight line.
D) bowed inward and then outward.
Correct Answer:
Verified
Related Questions
Q35: Q36: Q37: Q38: Q39: If you remove resources from factory production,the![]()
![]()
![]()
![]()

