Multiple Choice
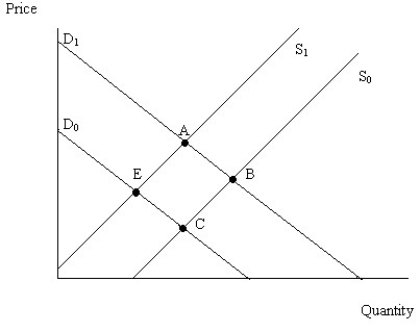
Figure 4.6
-Figure 4.6 illustrates a set of supply and demand curves for a product.When the economy moves from point B to point A,there has been
A) an increase in supply and an increase in demand.
B) a decrease in supply and a decrease in quantity demanded.
C) an increase in quantity supplied and an increase in demand.
D) an increase in quantity supplied and an increase in quantity demanded.
Correct Answer:
Verified
Related Questions
Q226: Using a graph,illustrate the effect that an
Q227: If a government imposes a tax on
Q228: If a government imposes a tax on
Q229: When a government pays a company for
Q230: The market equilibrium price and quantity can

