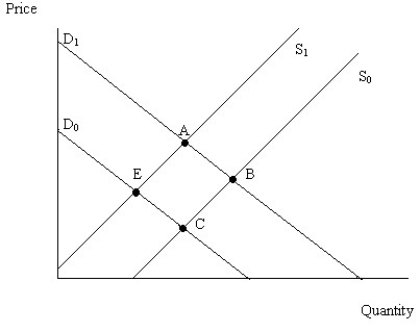
Solved

Figure 4.6 -Figure 4.6 Illustrates a Set of Supply and Demand Curves

Question 237

Multiple Choice

   Figure 4.6 -Figure 4.6 illustrates a set of supply and demand curves for a product.When the economy moves from point C to point E,there has been A)  an increase in supply and a decrease in quantity demanded. B)  a decrease in supply and a decrease in quantity demanded. C)  a decrease in quantity supplied and a decrease in demand. D)  an increase in quantity supplied and a decrease in quantity demanded.
Figure 4.6
-Figure 4.6 illustrates a set of supply and demand curves for a product.When the economy moves from point C to point E,there has been


A) an increase in supply and a decrease in quantity demanded.
B) a decrease in supply and a decrease in quantity demanded.
C) a decrease in quantity supplied and a decrease in demand.
D) an increase in quantity supplied and a decrease in quantity demanded.

Correct Answer:

verifed

Verified

Unlock this answer now
Get Access to more Verified Answers free of charge

Related Questions

Unlock this Answer For Free Now!

View this answer and more for free by performing one of the following actions

qr-code

Scan the QR code to install the App and get 2 free unlocks

upload documents

Unlock quizzes for free by uploading documents