Multiple Choice
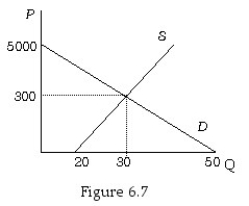
-Figure 6.7 shows the supply and demand curves for human kidneys.If the government set the price of a kidney at $5,000,then
A) 5,000 kidneys would be purchased.
B) 300 kidneys would be purchased.
C) 50 kidneys would be purchased.
D) 0 kidneys would be purchased.
Correct Answer:
Verified
Related Questions
Q68: In the market equilibrium,with a price of
Q69: Suppose that the equilibrium price of a
Q70: A minimum price set below the market
Q71: Rent control reduces market efficiency if the

