Use the following figure to answer the questions below.
In a very large population, a quantitative trait has the following distribution pattern:
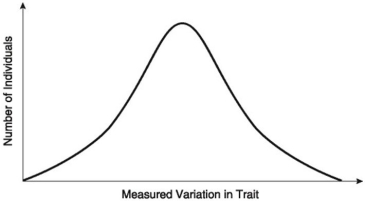
-What would be the most probable cause for a population depicted in the figure above to shift both to the left and to the right?
A) when large size is important
B) when there is an extreme environmental change
C) when there are few predators
D) when there are differences in the size of food items available to members of the same species
E) when the more common alleles are lost
Correct Answer:
Verified
Q22: Heterozygote advantage should be most closely linked
Q37: Most Swiss starlings produce four to five
Q42: A proficient engineer can easily design skeletal
Q51: The following questions refer to the following
Q51: The following questions refer to the following
Q53: Use the following figure to answer the
Q53: The same gene that causes various coat
Q58: The following questions refer to the following
Q59: In seedcracker finches from Cameroon, small- and
Q59: Anopheles mosquitoes, which carry the malaria parasite,
Unlock this Answer For Free Now!
View this answer and more for free by performing one of the following actions

Scan the QR code to install the App and get 2 free unlocks

Unlock quizzes for free by uploading documents