Consider the thermoacidophile, Sulfolobus acidocaldarius. Which of the following graphs most accurately depicts the expected temperature and pH profiles of its enzymes? (Note: The horizontal axes of these graphs are double, with pH above and temperature below.) 
A) 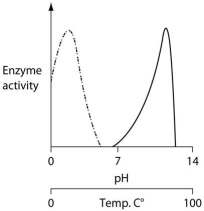
B) 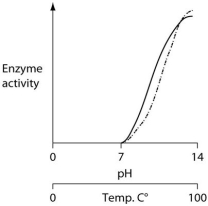
C) 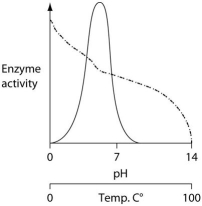
D) 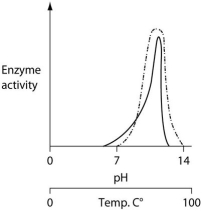
Correct Answer:
Verified
Q25: Broad-spectrum antibiotics inhibit the growth of most
Q39: Foods can be preserved in many ways
Q50: The following questions refer to Figure 27.1.
In
Q52: Figure 27.2 depicts changes to the amount
Q55: Figure 27.2 depicts changes to the amount
Q55: Members of Bacteria and Archaea benefit humans
Q56: Use the information in the following paragraph
Q57: The following questions refer to Figure 27.1.
In
Q57: Data were collected from the heterocysts of
Q60: The following questions refer to Figure 27.1.
In
Unlock this Answer For Free Now!
View this answer and more for free by performing one of the following actions

Scan the QR code to install the App and get 2 free unlocks

Unlock quizzes for free by uploading documents