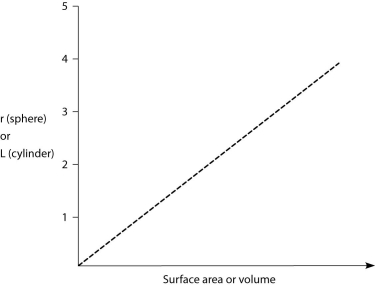
-Both axes of the graph are linear. Thus, the shape of the line plotted on this graph most accurately depicts the
A) volume of a sphere as the radius, r, increases.
B) surface area of a sphere as the radius, r, increases.
C) volume of a cylinder as length, L, increases.
D) surface area of a cylinder as length, L, increases.
Correct Answer:
Verified
Q57: The following figure depicts the outline of
Q58: The following figure depicts the outline of
Q59: Orchid seeds are tiny, with virtually no
Q60: A billionaire buys a sterile volcanic island
Q61: Which statement is a correct interpretation of
Q63: A researcher took water in which a
Q64: Which of the following microsporidian features are
Q65: Which of the following are protists, the
Q66: Sexual reproduction has not been observed in
Q67: When adult amphibian skin harbors populations of
Unlock this Answer For Free Now!
View this answer and more for free by performing one of the following actions

Scan the QR code to install the App and get 2 free unlocks

Unlock quizzes for free by uploading documents