Which graph properly depicts the relationship between the amount of gas in the swim bladder and the density of the fish?
A) 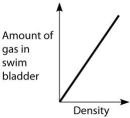
B) 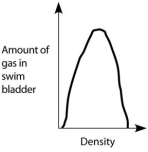
C) 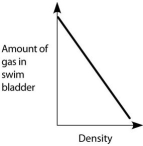
D) 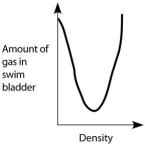
E) 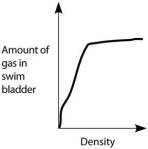
Correct Answer:
Verified
Q66: The following questions refer to the phylogenetic
Q69: When a shark stops swimming, it does
Q74: The following questions refer to the phylogenetic
Q74: At 5, 10, and 15 hours in
Q76: Which graph below best represents the way
Q77: Which of the following statements about human
Q83: The following questions refer to the description
Q84: Which feature of some carinates has the
Q90: The following questions refer to the description
Q92: Due to its system of nine air
Unlock this Answer For Free Now!
View this answer and more for free by performing one of the following actions

Scan the QR code to install the App and get 2 free unlocks

Unlock quizzes for free by uploading documents