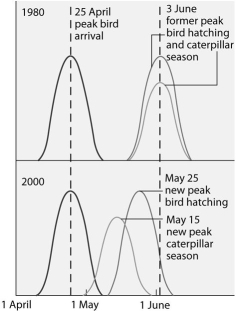
Use the graph and information provided in the paragraph below to answer the following questions.
Flycatcher birds that migrate from Africa to Europe feed their nestlings a diet that is almost exclusively moth caterpillars. The graph below shows the mean dates of arrival, bird hatching, and peak caterpillar season for the years 1980 and 2000.

-If the nestlings of flycatchers are to benefit from the shift in peak caterpillar season from June 3, 1980 to May 15, 2000, in which direction should the May 25, 2000 peak bird hatching date move?
A) to the left so it corresponds to the mean date of arrival in 2000
B) to the left so it corresponds with the new peak caterpillar season in 2000
C) to the right so there is no overlap in the May 15 and May 25 (year 2000) curves
D) no movement is necessary because the caterpillars grow slowly so the nestlings will have enough food to eat
E) no movement is necessary because herbicides can be used to kill the vegetation the caterpillars feed on and therefore the peak hatching time of caterpillars will move to the right from May 15 to May 25, 2000
Correct Answer:
Verified
Q48: Suppose you attend a town meeting at
Q49: The use of DDT as an insecticide
Q53: Q57: Use the graph and information provided in Q58: Use the graph and information provided in Q61: The main cause of the increase in Q64: Which of the following strategies would most Q65: Which of the following is a consequence Q66: Of the following statements about protected areas Q67: What is the single greatest threat to![]()
Unlock this Answer For Free Now!
View this answer and more for free by performing one of the following actions

Scan the QR code to install the App and get 2 free unlocks

Unlock quizzes for free by uploading documents