Figure 12-2 The Nerve Action Potential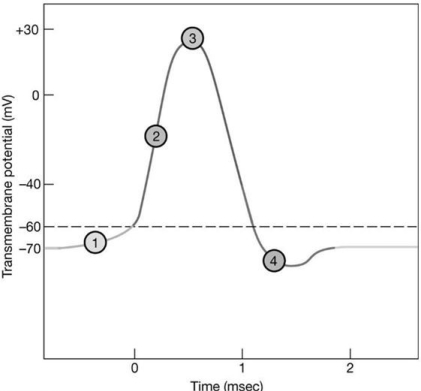
Use Figure 12-2 to answer the following questions:
-Which point of the graph shows when potassium ion outflow exceeds sodium ion inflow?
A) 1
B) 2
C) 3
D) 4
Correct Answer:
Verified
Q99: During repolarization of a neuron
A) sodium ions
Q100: The equilibrium potential of potassium is
A) -90mV.
B)
Q101: Figure 12-2 The Nerve Action Potential
Q102: The presence of _ dramatically increases the
Q103: Type _ fibers have the largest diameter
Q105: Figure 12-2 The Nerve Action Potential
Q106: Which of the following types of nerve
Q107: A neuron that receives neurotransmitter from another
Q108: Figure 12-2 The Nerve Action Potential
Q109: The _ principle states that the size
Unlock this Answer For Free Now!
View this answer and more for free by performing one of the following actions

Scan the QR code to install the App and get 2 free unlocks

Unlock quizzes for free by uploading documents