The graph of immigration over time to the United States shows 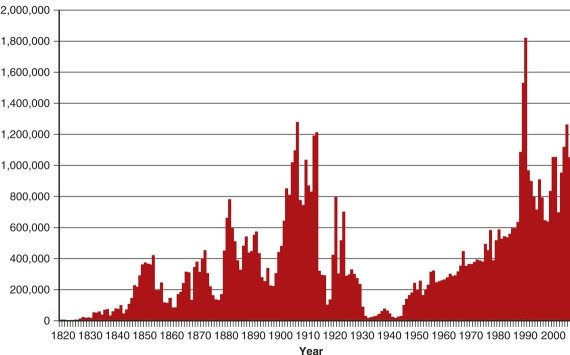
A) almost as much immigration in 2010 as 1910.
B) much immigration in the early 1900s when the U.S.did not restrict entry.
C) low points in immigration during the depression and World War II.
D) all of the above.
Correct Answer:
Verified
Q18: Net migration might be more important to
Q19: Which of the following examples best exhibits
Q20: One of the most severe problems with
Q21: In 2010 Arizona became a center of
A)a
Q22: Who often takes care of refugee camps?
A)the
Q24: Distance decay means
A)the farther you travel, the
Q25: The factor mobility model is most dependent
Q26: When people of Irish ancestry first came
Q27: Regarding migration decisions, behavioral geographers might say
Q28: If there were less immigration into the
Unlock this Answer For Free Now!
View this answer and more for free by performing one of the following actions

Scan the QR code to install the App and get 2 free unlocks

Unlock quizzes for free by uploading documents