In analyzing the graph showing the changing density patterns for Cleveland, in 1950 the highest population densities occurred ______________ miles from the CBD while in 1990 they peaked at _________________. 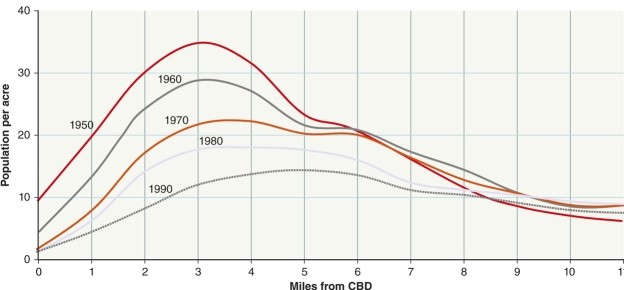
A) .5;2
B) 3;5
C) 4;8
D) 6;12
Correct Answer:
Verified
Q2: In terms of the 24 hour clock,
Q3: As a nodal point, which would a
Q4: In terms of density which would be
Q5: Traditionally, land values in the CBD were
Q6: Medieval cities had to be constructed to
Q8: In organic cities which of the following
Q9: At the center of the Spanish derived
Q10: Generally, skyscrapers are not built toward the
Q11: Another term for the structure or form
Q12: A trading city of the late Middle
Unlock this Answer For Free Now!
View this answer and more for free by performing one of the following actions

Scan the QR code to install the App and get 2 free unlocks

Unlock quizzes for free by uploading documents